
Application#
When do we use graphs? DAGs like airflow?
import networkx as nx
import matplotlib.pyplot as plt
Directed Acyclic Graph#
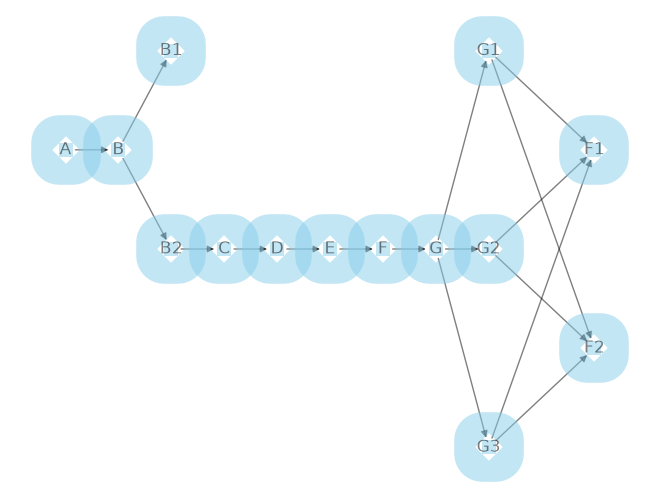
A: Data Extraction
B: Data Validation
B1: Terminate if data is invalid
B2: Continue if data is valid
C: Data Preparation
D: Hyperparameter Tuning
E: Model Training from Best Hyperparameter
F: Model Evaluation
G: Model Validation
G1: A/B Testing (Parallel)
G2: Compare with Previous Model (Parallel)
G3: Performance on various Segments (Parallel)
F1: Promote to Production if Model is Valid
F2: Terminate if Model is Invalid
G = nx.Graph()
# Add nodes to the graph
G.add_node('A')
G.add_node('B')
G.add_node('C')
G.add_node('D')
G.add_node('E')

# Add edges between nodes
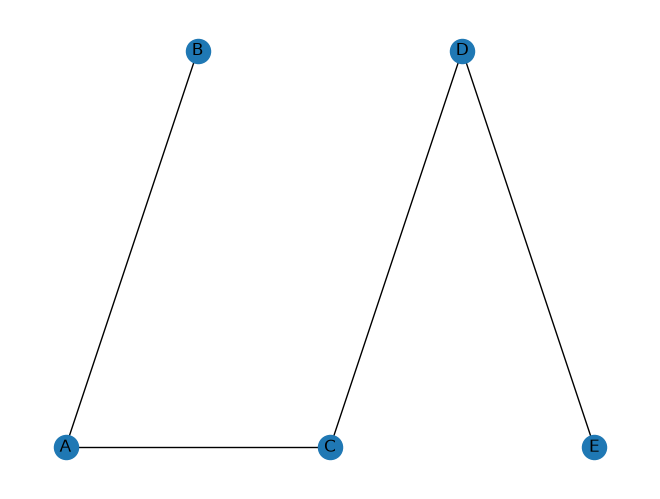
G.add_edge('A', 'B')
G.add_edge('A', 'C')
G.add_edge('C', 'D')
G.add_edge('D', 'E')

# Define positions for the nodes
pos = {'A': (1, 1), 'B': (2, 2), 'C': (3, 1), 'D': (4, 2), 'E': (5, 1)}

# Draw the graph using the specified positions
nx.draw(G, pos, with_labels=True)

# Show the plot
plt.show()
# import networkx as nx
# import matplotlib.pyplot as plt

# # Create an empty directed graph
# G = nx.DiGraph()

# # Add nodes and edges based on your process
# G.add_edge('A: Data Extraction', 'B: Data Validation')
# G.add_edge('B: Data Validation', 'B1: Terminate if data is invalid')
# G.add_edge('B: Data Validation', 'B2: Continue if data is valid')
# G.add_edge('B2: Continue if data is valid', 'C: Data Preparation')
# G.add_edge('C: Data Preparation', 'D: Hyperparameter Tuning')
# G.add_edge('D: Hyperparameter Tuning', 'E: Model Training from Best Hyperparameter')
# G.add_edge('E: Model Training from Best Hyperparameter', 'F: Model Evaluation')
# G.add_edge('F: Model Evaluation', 'G: Model Validation')
# G.add_edge('G: Model Validation', 'G1: A/B Testing')
# G.add_edge('G: Model Validation', 'G2: Compare with Previous Model')
# G.add_edge('G: Model Validation', 'G3: Performance on various Segments')
# G.add_edge('G: Model Validation', 'F1: Promote to Production if Model is Valid')
# G.add_edge('G: Model Validation', 'F2: Terminate if Model is Invalid')

# # Define positions for the nodes
# pos = {
#     'A: Data Extraction': (1, 6),
#     'B: Data Validation': (2, 6),
#     'B1: Terminate if data is invalid': (3, 7),
#     'B2: Continue if data is valid': (3, 5),
#     'C: Data Preparation': (4, 5),
#     'D: Hyperparameter Tuning': (5, 5),
#     'E: Model Training from Best Hyperparameter': (6, 5),
#     'F: Model Evaluation': (7, 5),
#     'G: Model Validation': (8, 5),
#     'G1: A/B Testing': (9, 7),
#     'G2: Compare with Previous Model': (9, 5),
#     'G3: Performance on various Segments': (9, 3),
#     'F1: Promote to Production if Model is Valid': (10, 6),
#     'F2: Terminate if Model is Invalid': (10, 4),
# }

# # Draw the graph using the specified positions
# nx.draw(G, pos, with_labels=True, node_size=1000, node_color="skyblue", node_shape="s", alpha=0.5, linewidths=40)

# # Show the plot
# plt.show()
import networkx as nx
import matplotlib.pyplot as plt

# Create an empty directed graph
G = nx.DiGraph()

# Add nodes and edges based on your process
G.add_edge('A', 'B')
G.add_edge('B', 'B1')
G.add_edge('B', 'B2')
G.add_edge('B2', 'C')
G.add_edge('C', 'D')
G.add_edge('D', 'E')
G.add_edge('E', 'F')
G.add_edge('F', 'G')
G.add_edge('G', 'G1')
G.add_edge('G', 'G2')
G.add_edge('G', 'G3')
G.add_edge('G1', 'F1')
G.add_edge('G1', 'F2')
G.add_edge('G2', 'F1')
G.add_edge('G2', 'F2')
G.add_edge('G3', 'F1')
G.add_edge('G3', 'F2')

# Define positions for the nodes
pos = {
    'A': (1, 6),
    'B': (2, 6),
    'B1': (3, 7),
    'B2': (3, 5),
    'C': (4, 5),
    'D': (5, 5),
    'E': (6, 5),
    'F': (7, 5),
    'G': (8, 5),
    'G1': (9, 7),
    'G2': (9, 5),
    'G3': (9, 3),
    'F1': (11, 6),
    'F2': (11, 4),
}

# Draw the graph using the specified positions
nx.draw(G, pos, with_labels=True, node_size=100, node_color="skyblue", node_shape="s", alpha=0.5, linewidths=40)

# Show the plot
plt.show()
topological_order = list(nx.topological_sort(G))
print(topological_order)
['A', 'B', 'B1', 'B2', 'C', 'D', 'E', 'F', 'G', 'G1', 'G2', 'G3', 'F1', 'F2']
import networkx as nx
import matplotlib.pyplot as plt

# Create an empty directed graph
G = nx.DiGraph()

# Add edges for tasks and their dependencies
G.add_edge('A', 'B')
G.add_edge('B', 'C')
G.add_edge('B', 'D')
G.add_edge('C', 'E')
G.add_edge('D', 'E')

# Define positions for the nodes
pos = {
    'A': (1, 2),
    'B': (2, 2),
    'C': (3, 3),
    'D': (3, 1),
    'E': (4, 2),
}

# Draw the graph using the specified positions
nx.draw(G, pos, with_labels=True, node_size=1000, node_color="skyblue", node_shape="s", alpha=0.5, linewidths=40)

# Show the plot
plt.show()
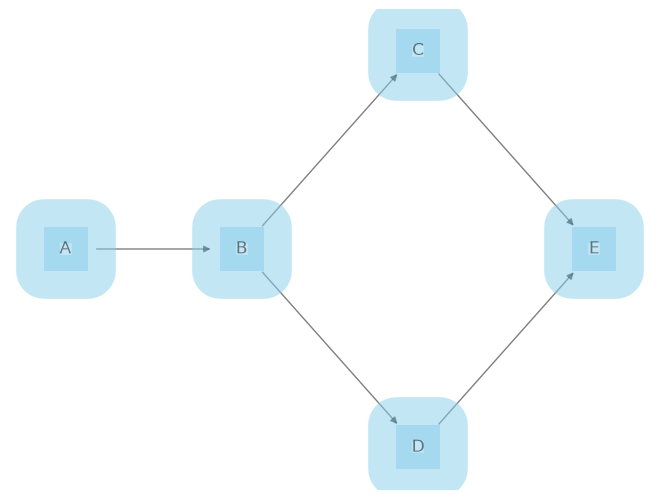
Topological sorts can return different valid sorts, for example, the below sort is produced by the above graph based on depth-first search (DFS) algorithm.
If you sort it topologically it gives [A, B, C, D, E] but [A, B, D, C, E] here
is also a valid sort.
# Get a topological sort of the nodes
topological_sort = list(nx.topological_sort(G))

print(topological_sort)
['A', 'B', 'C', 'D', 'E']
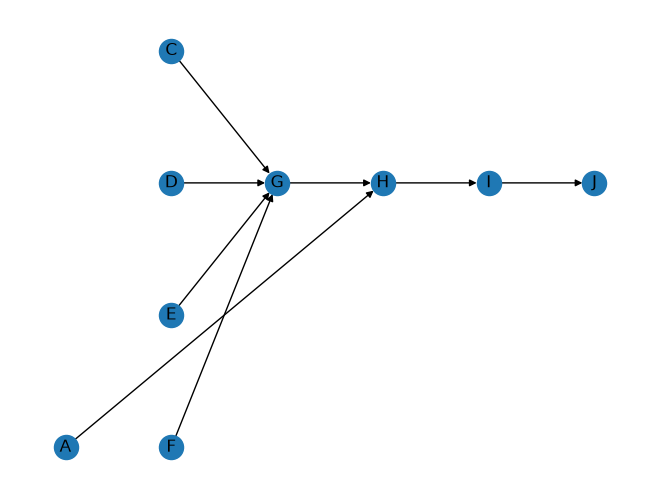
import networkx as nx
import matplotlib.pyplot as plt

# Create an empty directed graph
G = nx.DiGraph()

# Add nodes and edges based on your process
G.add_edge('C', 'G')
G.add_edge('D', 'G')
G.add_edge('E', 'G')
G.add_edge('F', 'G')
G.add_edge('G', 'H')
G.add_edge('A', 'H')
G.add_edge('H', 'I')
G.add_edge('I', 'J')

# Define positions for the nodes
pos = {
    'A': (1, 3),
    'B': (1, 1),
    'C': (2, 6),
    'D': (2, 5),
    'E': (2, 4),
    'F': (2, 3),
    'G': (3, 5),
    'H': (4, 5),
    'I': (5, 5),
    'J': (6, 5),
}

# Draw the graph using the specified positions
nx.draw(G, pos, with_labels=True)

# Show the plot
plt.show()
# Get a topological sort of the nodes
topological_sort = list(nx.topological_sort(G))

print(topological_sort)
['C', 'D', 'E', 'F', 'A', 'G', 'H', 'I', 'J']
import networkx as nx
import matplotlib.pyplot as plt

# Create an empty directed graph
G = nx.DiGraph()

# Add nodes and edges based on your process
G.add_edge('A', 'B')
G.add_edge('B', 'C')
G.add_edge('C', 'D1')
G.add_edge('C', 'D2')
G.add_edge('C', 'D3')
G.add_edge('D1', 'E1')
G.add_edge('D2', 'E2')
G.add_edge('D3', 'E3')
G.add_edge('E1', 'F')
G.add_edge('E2', 'F')
G.add_edge('E3', 'F')
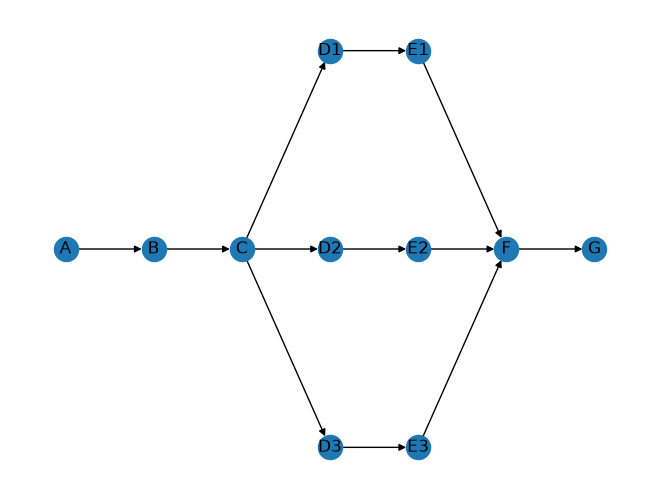
G.add_edge('F', 'G')

# Define positions for the nodes
pos = {
    'A': (0, 0),
    'B': (1, 0),
    'C': (2, 0),
    'D1': (3, 1),
    'D2': (3, 0),
    'D3': (3, -1),
    'E1': (4, 1),
    'E2': (4, 0),
    'E3': (4, -1),
    'F': (5, 0),
    'G': (6, 0),
}

# Draw the graph using the specified positions
nx.draw(G, pos, with_labels=True)

# Show the plot
plt.show()